Scientific plotting: The figures in my lab reports—four things I changed
The place where lab reports lose the most points is often not the data, but the figures.
In one report from the first semester of my sophomore year, I had calculated the data correctly, but the figures used the spreadsheet's default style: dense gridlines, the horizontal axis labeled "Time" with no unit, the legend covering the curves, and the title "Figure 1." My teacher's comment was: "The figure is understandable, but it doesn't look like a formal report."
Later, I settled on changing four things, and none of them was hard.
First: Axes need a quantity and a unit
Time (s), concentration (mol/L)—the unit goes in parentheses, and the quantity comes before it. Writing only "Time" doesn't work, because the reader doesn't know whether it's seconds or minutes.
Look at the tick marks too: if they're too dense, cut them in half; if too sparse, add more. My habit is to keep three to five major ticks, because with more than that, the reader can't see the key points.
Second: Remove the default decorations
What spreadsheets give you by default: gridlines, a legend border, background fill, and shadows. In a formal report, all four should basically be removed.
After deleting them, the figure will look "empty," but the reader's attention will return to the data.
Third: Don't let the legend cover the data
If the legend is inside the plot, it will almost certainly cover the curves. My approach is to put it in the blank space above the plot or label the ends of the curves directly.
For three or more curves, I distinguish them by line style (solid, dashed, dotted), not just by color—they must still be distinguishable when printed in black and white; this is the most basic requirement for a lab report.
Fourth: Write the title and caption separately
The figure title should read "Figure 1 Time curve for sample A" (number + what the figure shows).
The caption should state three things clearly: the conditions, the sample size, and what each line represents.
My principle is: someone should be able to understand what the figure is saying from the caption alone. When teachers grade reports, they usually look at the caption first. If the caption isn't clear, they won't have the patience to read the main text after it.
Comparison after the four changes
| What I changed | Default style | After revision |
| Axes | "Time" | "Time (s)" + 3–5 major ticks |
| Decorations | Gridlines, border, shadows | Remove all |
| Legend | Inside the plot, covering curves | Above the plot or at line ends, distinguished by line style |
| Title and caption | "Figure 1" | Number + content + conditions/sample size/line meanings |
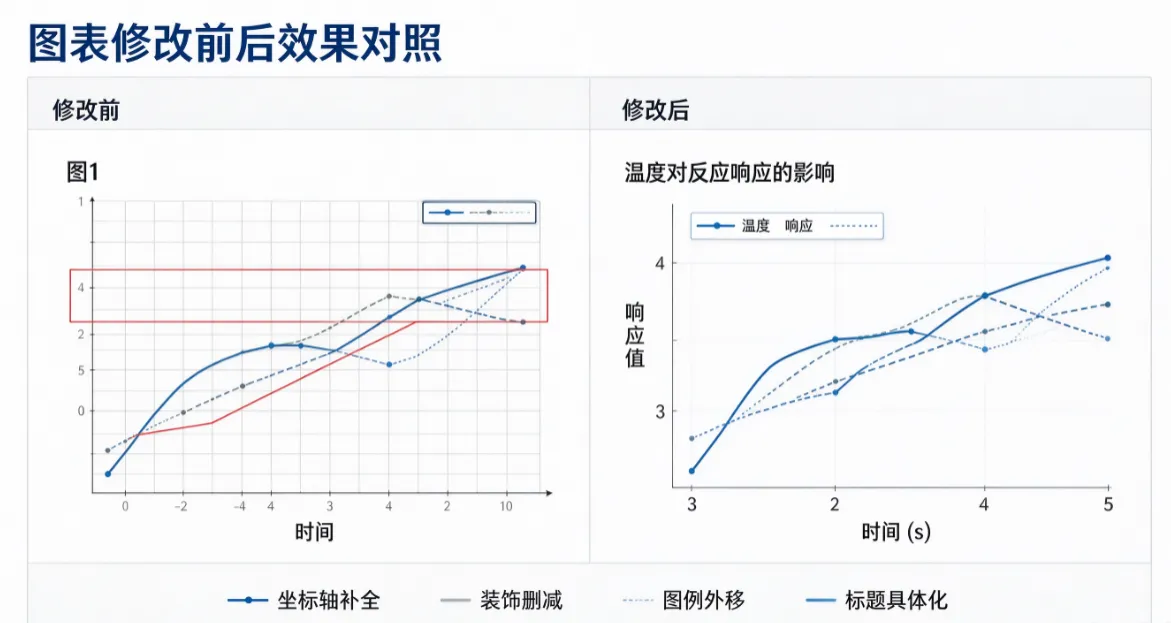 How I did it
For the first version of the figure, I used MuchSci's scientific plotting tool to make a draft. The advantage is that it puts all the necessary elements in place, and I only need to subtract—remove decorations, adjust ticks, and change the title.
I've learned an order for revising figures: first decide what the figure is trying to say, then adjust the style. At first, I always adjusted colors first, spent ages on it, and then realized that what the figure was trying to say wasn't clear in the first place—so the adjustments were wasted.
A few reflections
When it comes to figures in lab reports, what teachers look at is standardization. Whether the axes have units and whether the caption states the conditions—those two things immediately show whether the person writing the report took the data seriously.
Revising a figure doesn't take more than twenty minutes, but it determines whether others trust your data. I basically use MuchSci's scientific plotting only for the first version; after that, I do the subtraction manually on that figure. This is also the scenario where I most often use a college student AI assistant right now: let it produce a first draft of the figure, then I revise the rest myself according to the standards.